Visualization
PPPx writes a .pos solution and an RTKLIB-compatible .stat file, so you can visualize results in the browser, with the bundled Python script, or with RTKLIB.
With the PPPx Web Viewer
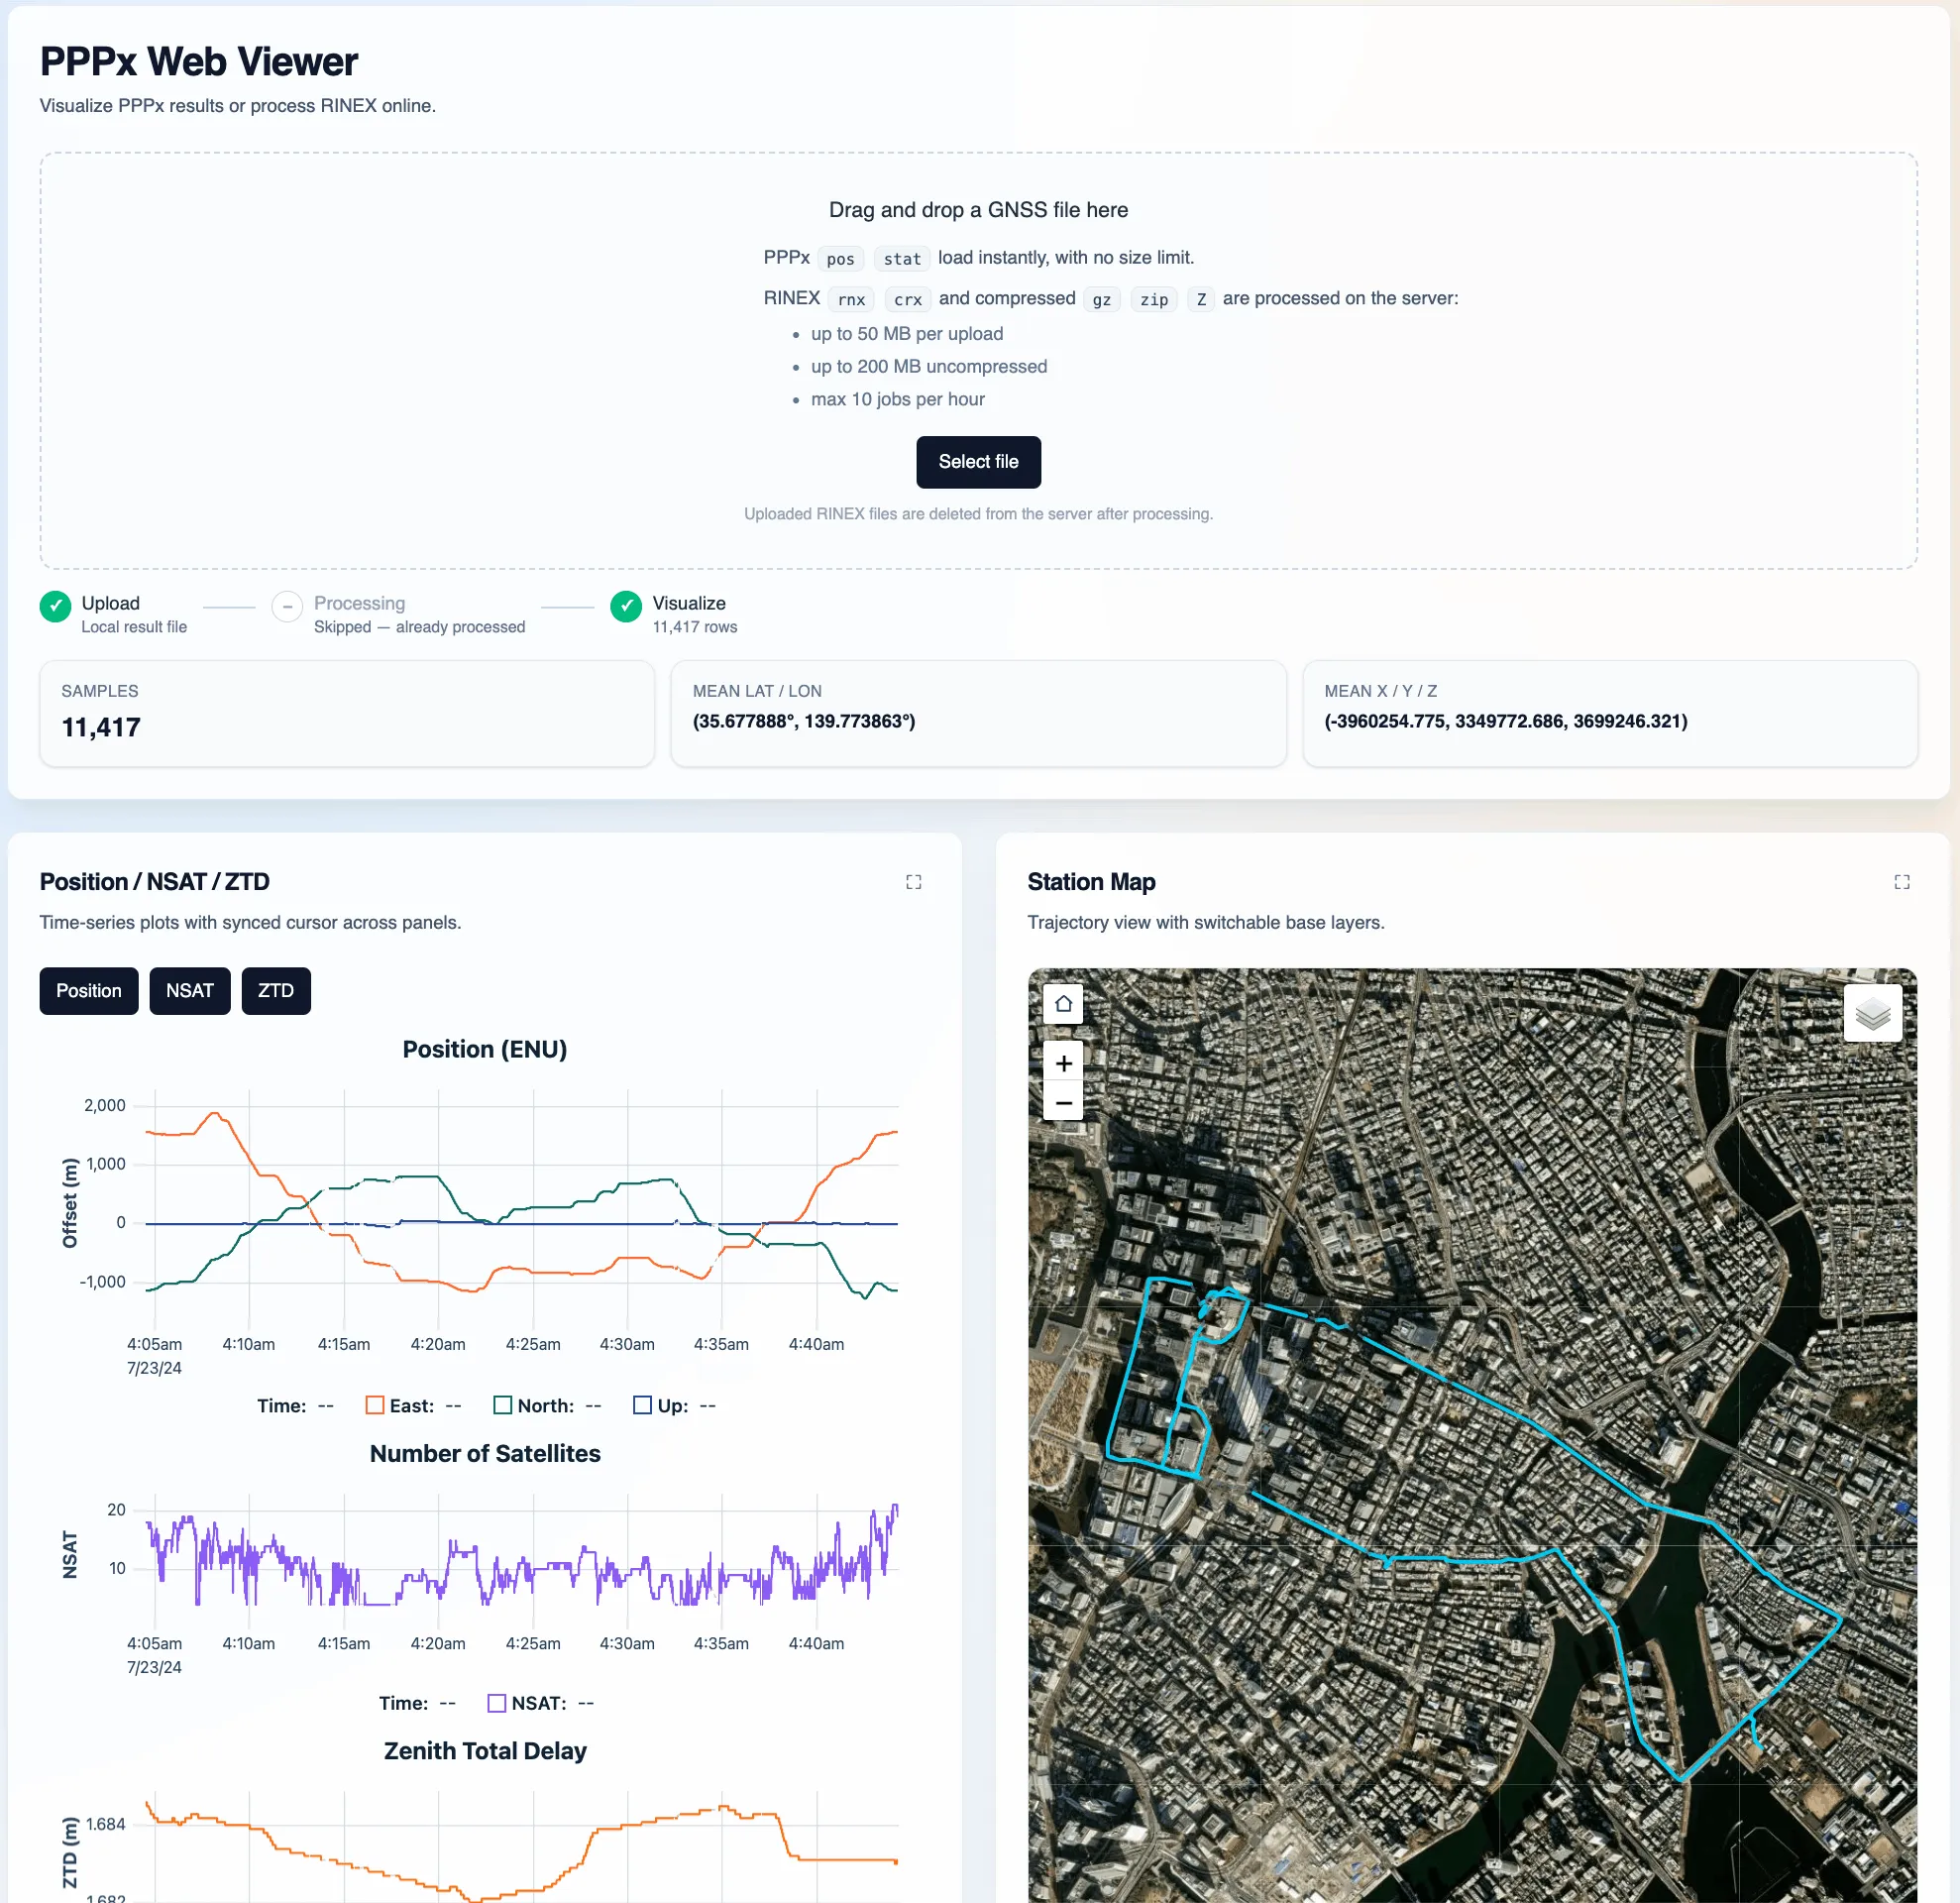
Section titled “With the PPPx Web Viewer”The PPPx Web Viewer is a browser-based app for viewing PPPx results interactively. It takes a PPPx .pos or .stat file as input and offers two main views: a position time series and a map view of the solution. Being entirely browser-based, it needs no installation and works on any platform.
Just open app.pppx.dev and load a .pos or .stat file. The viewer can also process a RINEX observation file on the server with a fixed PPP configuration — see Try it online.
With Python: plot_ppppos.py
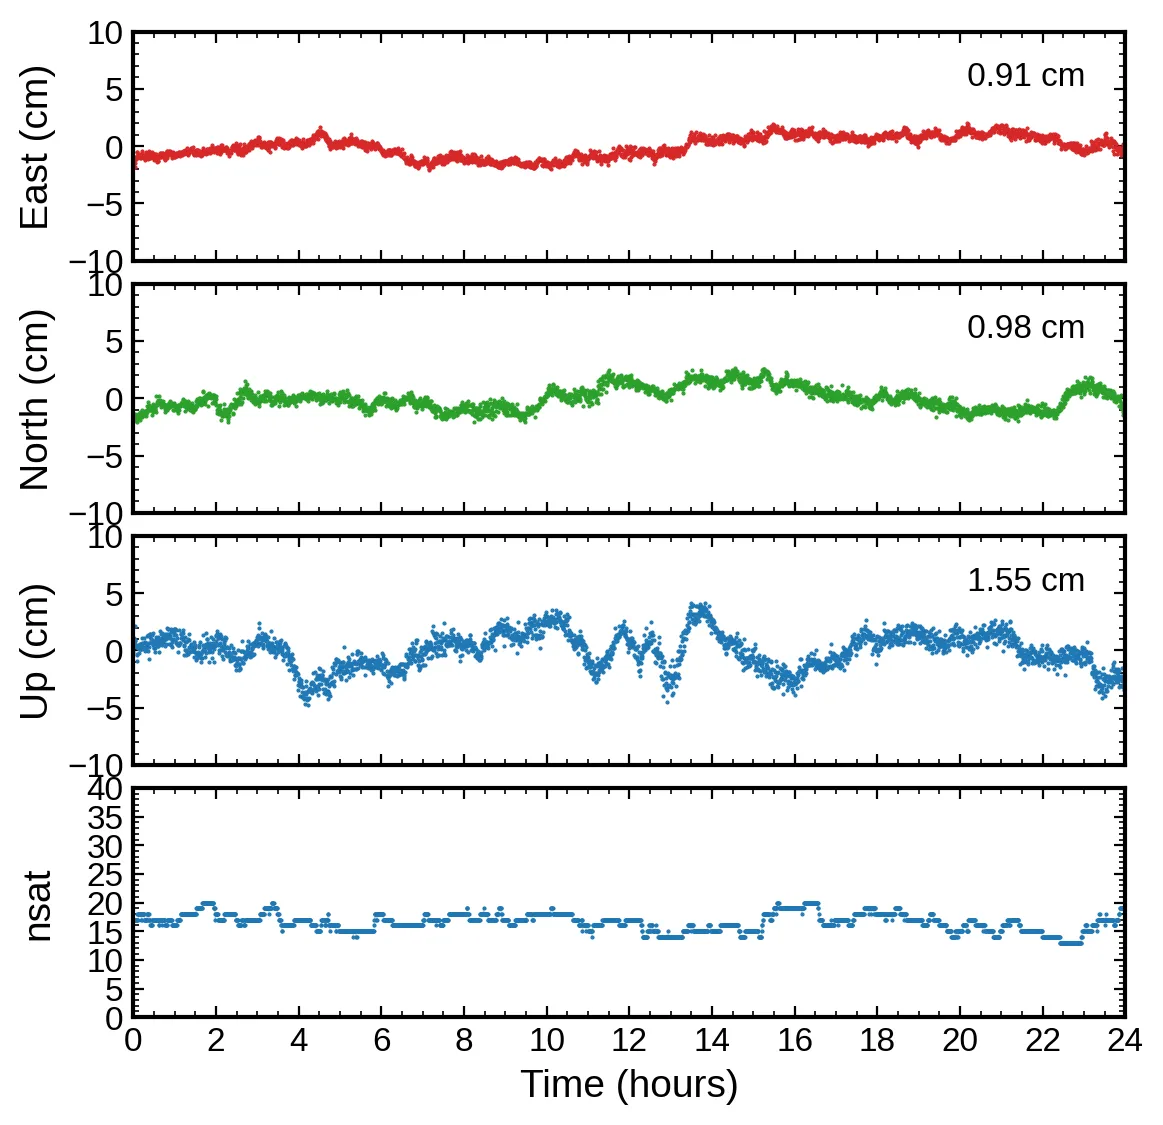
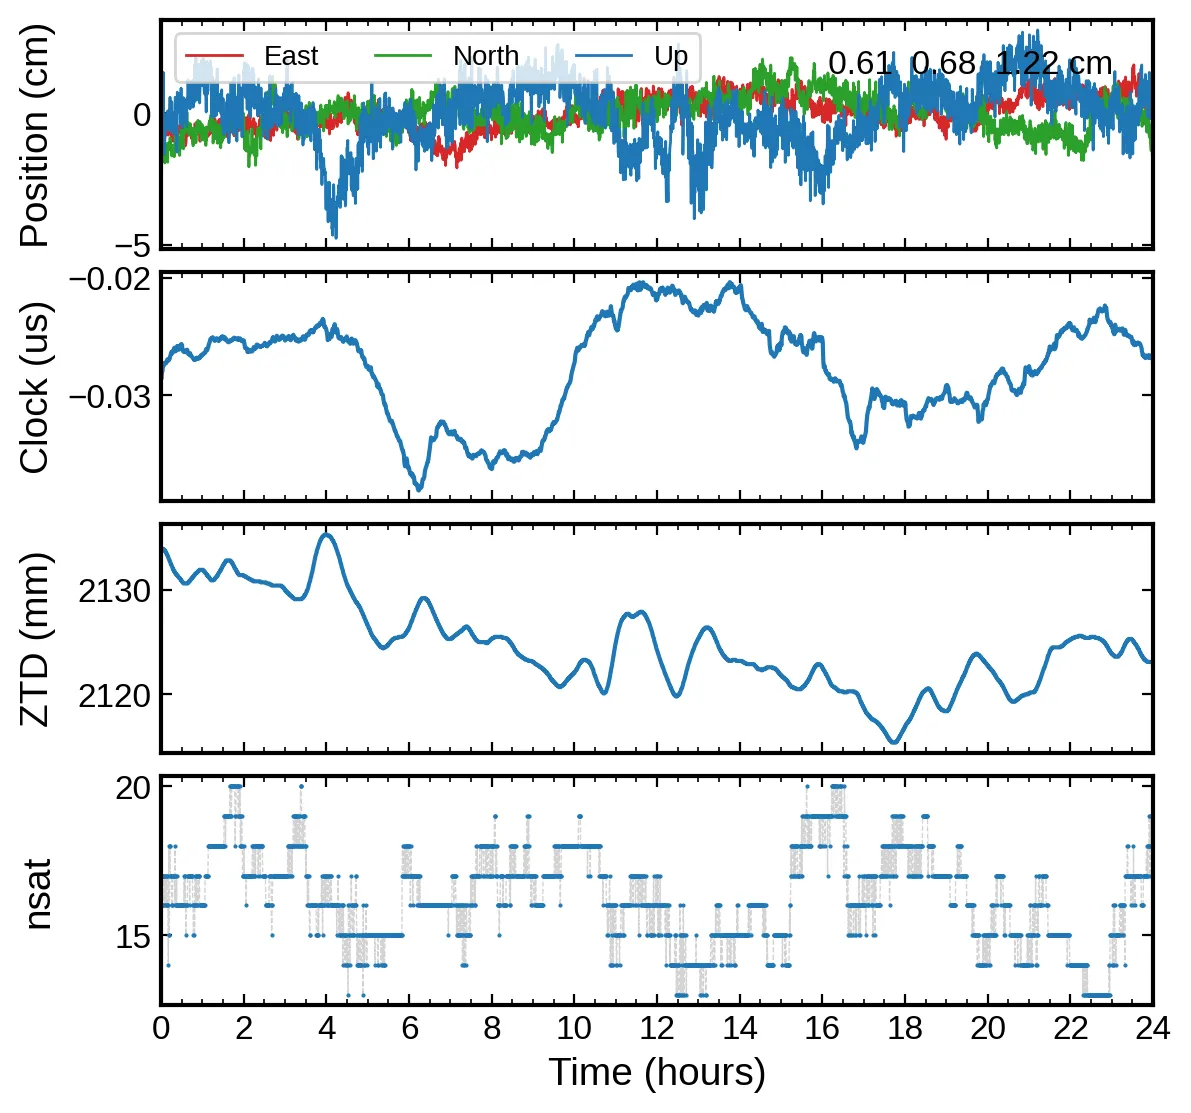
Section titled “With Python: plot_ppppos.py”The plot_ppppos.py script in the repository’s scripts/ folder plots a .pos file. It can show either the position time series (east/north/up relative to the mean) or the full set including the receiver clock and ZTD.
# (1) position estimates only../../scripts/plot_ppppos.py path/to/solution.pos -s
# (2) position, receiver clock, and ZTD../../scripts/plot_ppppos.py path/to/solution.pos -a
Options:
| Option | Effect |
|---|---|
-a | Plot position and receiver clock and ZTD. |
-s | Fixed (scaled) y-axis; otherwise the scale is automatic. |
-i | Interactive plot window (otherwise a PNG is saved). |
-s (position only) | -a (position + clock + ZTD) |
|---|---|
 |  |
With RTKLIB
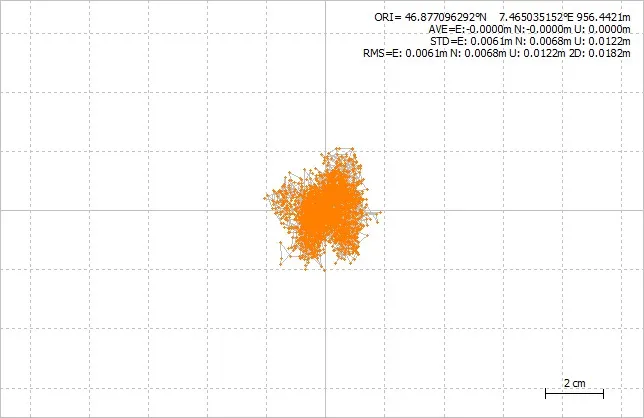
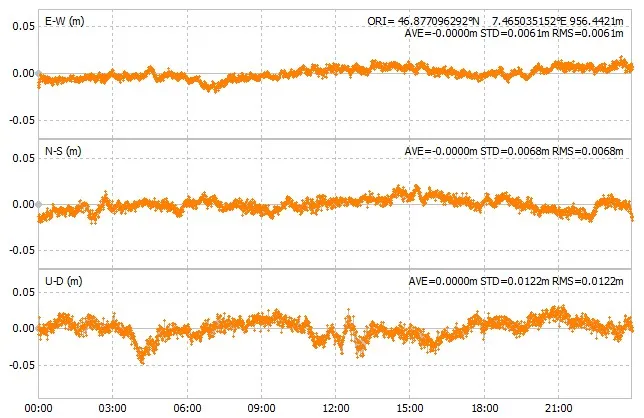
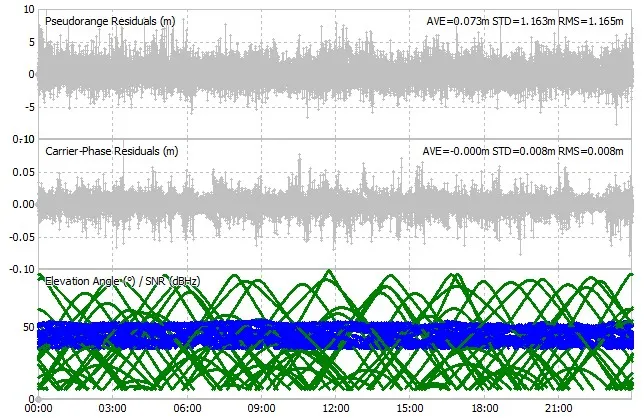
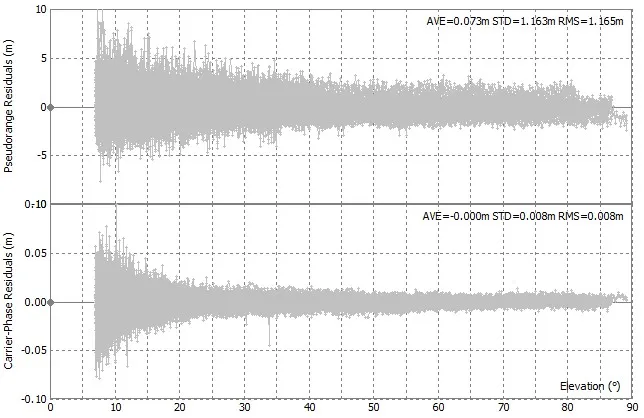
Section titled “With RTKLIB”For richer, interactive plots — including post-fit residuals — open the .stat file in RTKLIB’s RTKPLOT.
- Open
rtkplot(rtkplot.exeon Windows). - File → Open Solution-1 and select the PPPx
.statfile. - Switch between the ground-track, position, and residual views.
You can open a second solution in the same window to compare two runs side by side.
| Ground track | Position time series |
|---|---|
 |  |
| Residuals vs. time | Residuals vs. elevation |
|---|---|
 |  |